The MTS Biotech Monitor H1:2018 Preview – The Fourth Generation of Biotech IPOs Continues to Follow Moore’s Law – Avg GP $100M/Avg MC $400M is the New Avg GP $50M/Avg MC $200M
MTS will publish its next H1:2018 edition of our “MTS US Biotech IPO Monitor” shortly (previous version can be accessed here), where we use our proprietary database* to generate and discuss thought-provoking statistics and observations on the US Biotech IPO market. MTS’ “Strategic Advisory Analytics” reports exemplify our value add strategic advisory services to clients across all healthcare industry sub-sectors. Corporates and institutional investors can request a full version of our reports and to be added to our distribution list by sending an email to Marissa Feinstein (feinstein@mtspartners.com).
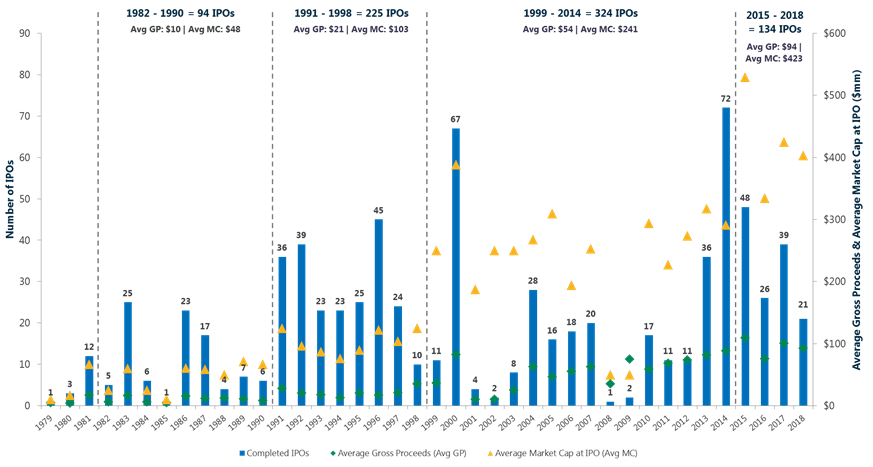
As an amuse-bouche for the H1:2018 MTS monitor, we are flagging the observation that we are squarely in the 4th generation of biotech IPO valuations. Exhibit 1 shows the number, average gross proceeds (Avg GP) and post money valuations (Avg MC) since the dawn of biotech. As always, thanks to Stelios “The Godfather” Papadopoulos – the only provider of accurate historical IPO data in our opinion (who, no doubt, uses “quill and ink” technology).
The most interesting macro observation, in our eyes resides in the “four step changes” in valuations.
- 1. “Generation-X biotech” ’82-’90 – Avg GP: ~$10m/Avg MC: ~$50m – It was all new and no one knew it was going to work. “So these academics are going to grow proteins and take on Large Pharma….sure.”
Notable data points: The first Biotech IPO was BioResponse in October 1979, followed by Enzo in June 1980. The first generation of eventual bellwethers IPO prints were Genentech in October 1980, Biogen in February 1983, Amgen in June 1983, Genzyme in June 1986 and Celgene in August 1987. - 2. “The 90’s biotech” ’91-’98 – Avg GP: ~$20m/Avg MC: ~$100m – The first generation of biotech products (Biotech 1.0 products) made it through the regulatory system and to the market. “Umm…those biotech guys can actually make cool drugs….maybe some of those drugs could even be big drugs.”
Notable data points: Idec’s Rituxan was launched in 1997, Centor’s Remicade and Immunex’s Enbrel were launched in 1998, and Genentech’s Herceptin was launched in 1999. PS: Gilead IPO’ed in January 1992. - 3. “New millennia biotech” ’99-’14 – Avg GP: ~$50/Avg MC: ~$200m – A period with four overlapping drivers: (1) the dotcom driven genomics start (’99-’01), (2) the rapid and huge commercial success of Biotech 1.0 products (’02-’10), (3) the launch of the 2nd generation of blockbuster products (Biotech 2.0 products) from the large cap biotech companies delivering pharma-busting double digit top and bottom line growth rates, and (4) the high tide mark of 72 biotech IPOs in 2014. “Wow, ok. Those biotech-originated drugs, whether they are biologics or small molecules are commercially more successful than most pure play pharma-originated molecules…maybe it’s the “biotech business model” that is the secret sauce.”
Notable data points: By 2010 top selling drugs, analyzed by WW sales and ranking, were Enbrel $7Bn (#3), Remicade $6.4Bn (#5), Herceptin $5.2Bn (#8) and Rituxan $5.1Bn (#9). Biogen-Idec’s Tecfidera (peak estimate at the beginning of 2015 was $5.2Bn) and Gilead’s Sovaldi/Harvoni (peak estimate at the beginning of 2015 was $14Bn ….umm) were launched in 2013, which at the beginning of 2015 helped drive large cap biotech’s 3 year forward estimated CAGR to 15%. - 4. “Generation Z biotech” ’15-TBD – Avg GP: ~$100/Avg MC: ~400m – A combination of multiple high science breakthroughs (most notably I-O and gene therapy), and now established view that biotech is better business model and is best “self-funded” (i.e. equity vs. strategic), combined with some notable M&A exits from the recent class of 2012 to 2015, resulted in the most recent step-up change in IPO’s valuation. “I am more than happy to pay handsomely for that biotech secret sauce.”
Notable data points: A plethora of “true first generation” gene/cell therapy drugs got approved including Biogen’s Sprinraza (December 2016), Sarepta’s Exondys 51 (September 2016), Novartis’ and Gilead’s/Kite’s CART (Kymriah in August 2017 and Yescarta in October 2017) and Spark’s Luxturna (December 2017). Notable M&A deals include AveXis by Novartis ($8.7Bn, 2.16 years after 2016 IPO for a 989% premium to IPO), Juno by Celgene ($9Bn, 3.21 years after 2014 IPO for a 310% premium to IPO), Kite by Gilead ($11.9B, 3.29 years after 2014 IPO for a 958% premium to IPO), CoLucid by Eli Lilly ($960mm, 1.82 years after 2015 IPO for a 365% premium to IPO) and Receptos by Celgene ($7.2Bn, 2.30 years after 2013 IPO for a 1557% premium to IPO).
So whilst the above step-up change is an interesting observation, it still leaves open the fundamental question of why the doubling in funds raised and valuations a la Moore’s Law style (ok, except the 18 month/2 year element).
Suggestions welcome…
Exhibit 1: The 40 Years of US Biotech IPOS: Four Step Changes – – Average Gross Proceeds (GP) and Average Market Cap (MC) at IPO
*MTS IPO Database
The MTS bespoke IPO database includes the 784 US Biotech IPOs from the first 1979 US Biotech IPO with micro detailed analysis from 2012. Special thanks to Stelios “The Godfather” Papadopoulos for the historic data.
Securities related transactions are provided exclusively by our affiliate, MTS Securities, LLC, a broker-dealer registered with the SEC and a member of FINRA and SIPC. This Strategic Advisory Analytics report does not qualify as research pursuant to FINRA Rule 2711. A related party, Windrose Health Investors, LLC, an SEC registered investment adviser, provides investment advisory services to private equity investors. This publication may not be copied, reproduced or transmitted in whole or in part in any form, or by any means, whether electronic or otherwise, without first receiving written permission from MTS Health Partners, L.P. and/or its affiliated companies (collectively, “MTS”). The information contained herein has been obtained from sources believed to be reliable, but the accuracy and completeness of the information are not guaranteed. All products, names, logos and brand references are the property of their respective owners. All third-party company product, and brand references used in this publication are for identification purposes only. Use of these names, logos and brand references does not imply endorsement by MTS. The information in this publication is not intended to constitute a recommendation upon which to base an investment decision. Neither MTS nor any of its associated persons are affiliated with the companies referenced in this publication nor to date, has MTS provided financial advisory services to these companies, although it may provide or seek to provide such services in the future