The MTS Biotech Monitor – “Back to School” Edition Sept 2018 Update – Early-Stage IPO Performance: Phase I is the New Phase II
Early-stage Biotech IPO’s: Phase I is the New Phase II
As a “Back to School” prequel of the next edition of the MTS IPO monitor (Q3:2018 edition due in October), we have conducted a further level of analysis on the observation we made in previous IPO Monitor editions (here) that garnered the most debate with companies and investors. Full version of the “Back to School” IPO Monitor can be accessed here.
The observation was that “early-stage” companies (defined as companies with Preclinical or Phase I lead assets at the time of IPO) had become a significant proportion of IPOs in the current window and somewhat counterintuitively had the highest IPO valuations and raises (relative to later-stage companies). Of all 276 biotech IPOs from 2012 through 2018 (YTD), 74 (27%) were early-stage with an average IPO valuation/raise of $457mm/$113mm vs. mid-stage (Phase II) of $343mm/$84mm and late-stage (Phase III or later) of $394mm/$88mm. YTD 2018 represented a high-tide mark with 16 of 44 (36%) companies IPO’ed being early-stage companies, beating both mid-stage 15 of 44 (34%) and late-stage companies 13 of 44 (30%). This surprisingly high number and proportion along with the valuations of early-stage IPOs confounds the old mantra that Phase II is the main stage of entry level for IPOs and that earlier stage companies are higher risk and therefore should have lower valuations. Within this report we conducted new and more detailed analyses (Exhibits 1-8) of 2012 -2018 (YTD) IPOs focusing on early-stage companies, which demonstrate some fascinating new data points (with the normal caveat that we are taking averages of a very heterogeneous set of companies).
Key Messages:
Phase I Companies Now Represent the Biotech IPO Sweet Spot
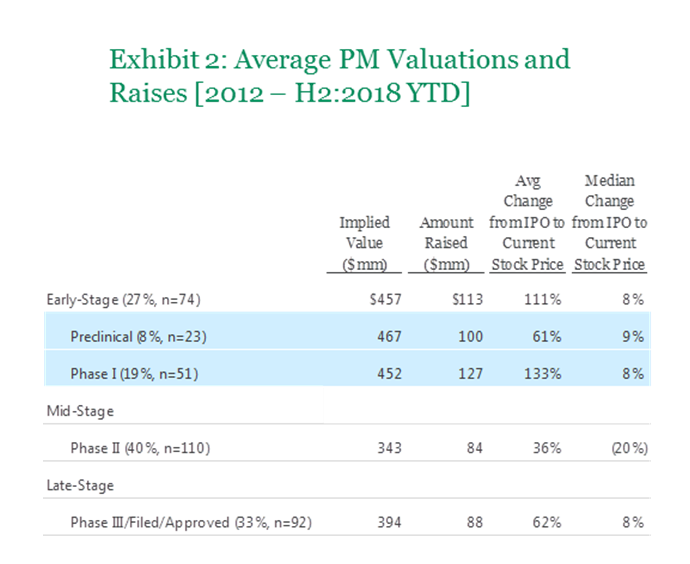
As shown in Exhibits 1-3, early-stage Biotech IPOs have become a larger and more notable component of the Biotech IPO ecosystem over the last 7 years. Interestingly, Phase I companies have become the sweet spot when balancing the amount raised at IPO (#1 spot at an average/mean $127mm), valuation (average/mean of $452mm, with Preclinical companies holding the #1 spot at very slightly higher valuation of an average/mean $467mm), number/proportion of companies (a reasonable 19% over the 7 year period) and post-IPO stock performance (#1 at an average/mean +133%).
Early-Stage Stock Price Performance – Go Big or Go Home
As shown in Exhibits 2, 7 and 8 there is a plethora of interesting observations around IPO to date performance of the early stage companies. As we previously noted, Phase I companies have the accolade of the strongest average/mean performance of +133%, not far followed by Preclinical companies at an average/mean +61%. Together, the combined Early-Stage companies have an average/mean performance of 111% vs. 36% for Mid-Stage and 62% for Late-Stage companies. Whilst we all love mathematical means, they tend to not tell the complete story (hint look at the medians in Exhibit 2). Thus in Exhibits 7 and 8 we show the granular performance distribution for Preclinical and Phase I companies, which reveals a further level of interesting artifacts: (1) the distribution of Outperformers to Underperformers is ballpark 1:1 for both Preclinical (accurately 57% : 43%) and Phase I companies (accurately 51% : 49%), (2) The average Outperformer is much bigger than the average Underperformer: Preclinical (+133% : -55%) and Phase 1 (+296% : -38%)
The observation around the bigger magnitude of the average outperformance vs. the average underperformance is of course logical – you can not lose more than 100% of a stock price (and failure often results in a set towards cash levels), but you can outperform multiples of your investment, especially in biotech. The stronger average outperformance of the Phase I over Preclinical companies is also intuitive; the Phase I IPO class has had more chance to mature to late stage/commercial stage companies (e.g. Sage and Loxo) and concomitant M&A exits (e.g. Kite, Juno) than the Preclinical IPO class for which the outperformance is still being driven by relatively early-stage “fundamental platform” companies (e.g. Editas, Crispr and Wave). A notable example of performance success by a Preclinical company is Agios as it hits the commercial life cycle stage (que “Welcome back Jackie and congrats David” call out). What is most perplexing to us is: Why is there the near 1:1 ratio of Outperformers/ Underperformers? Who said that investing in biotech is like flipping a coin?
Early-stage IPO Companies are Largely “Platform” Companies with Clinical Triggers Less than 1 year Out from IPO
As shown in Exhibit 4, the vast majority of early-stage IPO companies are “Platform” vs. “Asset(s)” based, with essentially all Preclinical companies being platform (we understand there is some subjectivity to assigning platform vs. asset-based label, a debate in and of itself). The dominance of platform-based companies is not surprising for early-stage companies. A more interesting debate is what allowed the few asset-based Phase I companies to IPO. The macro answer is that they were largely oncology assets. Notwithstanding the platform nature of these companies, it is interesting to note that the median (more relevant than the mean in our view) time to the clinical trigger was less than one year: 0.63 years for Preclinical companies launching clinical trials and 0.68 years for Phase I companies reading out Phase I data (Appendix). This clearly illustrates that public markets still require a clear (and relatively quick) pathway to value inflection.
Gene Therapy Companies Dominate the Modality Type for Early-Stage Companies
As shown in Exhibit 5, Gene Therapy companies, somewhat understandably, have dominated the early-stage company space. 57% of Preclinical and 31% of Phase I companies’ lead asset utilized gene therapy.