The MTS Biotech IPO Monitor – Edition 4: Q3 2018 Update – 2018 Looking to Beat the 2014 High Tide Mark For Biotech IPOs
This is the fourth edition of our “MTS US Biotech IPO Monitor” where we will use our proprietary database* to generate and discuss thought-provoking statistics and observations. IPO Monitor is one of the pieces published by Strategic Advisory Analytics group at MTS. MTS’ “Strategic Advisory Analytics” reports exemplify our value add strategic advisory services to clients across all healthcare industry sub-sectors. A redacted version of the IPO Monitor can be accessed here . Corporates and institutional investors can request a full version by sending an email to any partner at MTS.
A strong Q3:2018 on number and initial IPO valuations…
- Q3:18 was a strong quarter in terms of the number of IPOs, 17 IPOs in Q3:18, which is the same number of IPOs as the 2014 banner year vs. 10 in Q3:17, 6 in Q3:16 and 10 in Q3:15
- 018 YTD average raise/post money valuation was stronger than full previous years at $101/$483m vs. FY17 $100m/$425m, FY16 $76m/$334m, FY14 $89m/$291m, but lower than the FY15 $109m/$529m
…with a scattered performance
- 10 out of the 17 Q3:18 IPOs have posted gains at an impressive average of +59%; The 7 underperformers have an average loss of -28%
- Mean IPO to current performance for class of 2018 YTD +20% vs. class of 2017 +61%, class of 2016 +96%, and class of 2015 +17%
Phase I is the New Phase II – Phase I companies now represent the Biotech IPO sweet spot
- Phase I companies now represent the Biotech IPO sweet spot
– Phase I companies have become the sweet spot when balancing the amount raised at IPO - Early-Stage stock price performance – Go Big or Go Home
– Phase I companies have the strongest average/mean performance of +125%, not far followed by Preclinical companies at an +54% - Early-stage IPO Companies are largely “Platform” Companies with Clinical Triggers less than 1 year out from IPO
– The vast majority of early-stage IPO companies are “Platform” vs. “Asset(s)” based - Gene Therapy companies dominate the modality type for Early-Stage companies
– Gene Therapy companies, somewhat understandably, have dominated the early-stage company space. 57% of Preclinical and 31% of Phase I companies’ lead asset utilized gene therapy
5 Key Messages From Detailed Analysis of 2012-Q3:2018 IPOs
- “Quality” Over Stage of Asset: Pre-Clinical/Phase I IPOs Have Higher Raises and Valuations than Phase II and Phase III Companies
- Gene Therapy Companies Continue to Garner Higher Raises and Valuations than Small Molecule Companies
- 85% of IPOs Are Still Trading As Original Entities; Exits: 9% M&A, 4% Reverse Merger, 2% Bankrupt or Delisted
- Foreign Issuers Have Broad Access to US Capital Markets – Higher Quality Companies Eventually Gravitate to US listings
- ~30% Insider Participation Continues to be an Important Factor for a Successful IPO
*MTS IPO Database
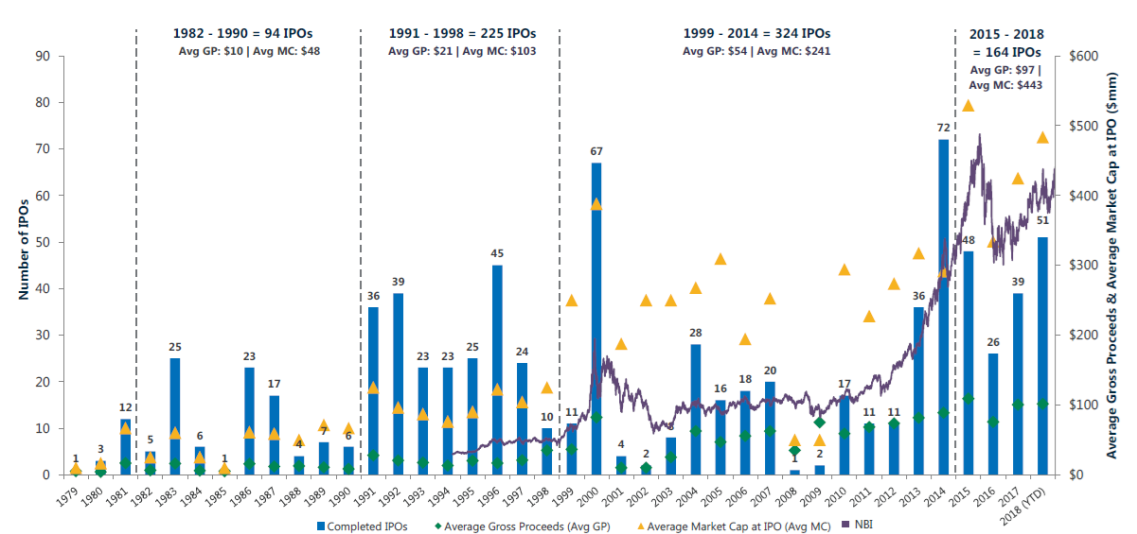
The MTS bespoke IPO database includes the 823 US Biotech IPOs from the first 1979 US Biotech IPO with micro detailed analysis from 2012. Special thanks to Stelios “The Godfather” Papadopoulos for the historic data.