The MTS US Biotech IPO Monitor: 2017 Was a Banner Year – How Does This Bode For 2018, The 40th Birthday For The US Biotech IPO Market?
This is the first edition of our “MTS US Biotech IPO Monitor” where we will use our proprietary database* to generate and discuss thought-provoking statistics and observations. IPO Monitor is one of the pieces published by Strategic Advisory Analytics group at MTS. MTS’ “Strategic Advisory Analytics” reports exemplify our value add strategic advisory services to clients across all healthcare industry sub-sectors. A redacted version of the IPO Monitor can be accessed here. Please request a full version by sending an email to mehrotra@mtspartners.com.
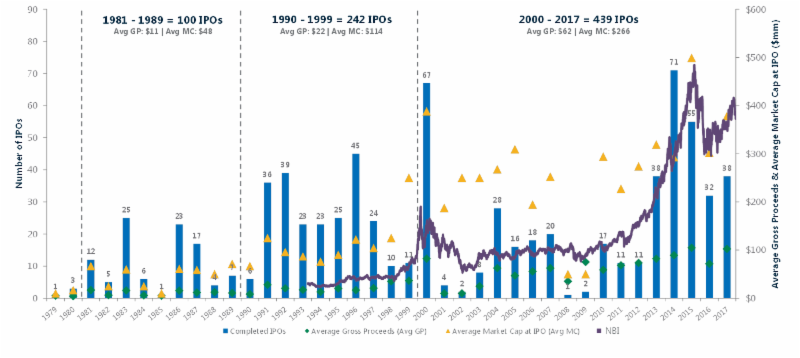
The US Biotech IPO Market in 2017 – Actually a Banner Year
2017 was the 39th year of US Biotech IPOs and was a Top 4 year on a Number of Matrices;
2nd Best Year for Average Gross Proceeds – $102mm for 2017 vs. $62mm on average since 2000 (only eclipsed by 2015)
3rd Best Year for Average Post Money Market Cap at IPO – $378mm for 2017 vs. $266mm on average since 2000 (only eclipsed by 2000, 2015)
4th Best year for Total Post Money Market Cap and Total Gross Proceeds – Total post money market cap: $14B for 2017 vs. $8B and total gross proceeds $3.9B for 2017 vs. $1.9B average since 2000 (only eclipsed by 2000, 2014, 2015)
5 Key Messages From Detailed Analysis of 2012-2017 IPOs
- 1. “Quality” Over Stage of Asset: – Pre-Clinical/PI IPOs Have Higher Raises and Valuations than PIII Companies; the average raise/average post money valuation for the 245 IPOs from 2012-2017 were: early-stage: $91mm/$370mm, mid-stage $94mm/$346mm; late-stage $87mm/$359mm.
- 2. Gene Therapy Companies Garner ~50% Higher Raises and Valuations Than Small Molecule Companies – The average raise/average post money valuation for the 245 IPOs from 2012-2017 were: small molecule $83mm/$294mm, biologic $93mm/$435mm;gene therapy $122mm/$464mm, Other $76mm/$330mm.
- 3. 88% of IPOs Are Still Trading As Original Entities – Of the 245 US Biotech IPOs over the last 6 years, 16 (6.5%) were acquired (at an average premium of 354%), 8 (3.3%) had lead asset failures and exited via a reverse merger (at an average discount of 75%), and 5 (2.0%) filed for bankruptcy.
- 4. Foreign Issuers Increased Access to US Capital Markets – in 2017 there were 7 foreign companies that IPO’d, raising ~20% of total amount raised and representing ~26% of total post money valuation for the year.
- 5. ~30% Insider Participation is an Important Factor of a Successful IPO – Over the last 6 years, average insider participation in biotech sector was in the range of 23%-40%. 2017 year is the 3rd highest after 2016 and 2012 by the amount of insider participation.
How Does This Bode For the 2018 US IPO Market?
Private US and foreign issuers can request an additional presentation of our views, sensitivities, headwinds and tailwinds for the 2018 Biotech IPO market by contacting: Ravi Mehrotra mehrotra@mtspartners.com, Mark Epstein epstein@mtspartners.com, or any partner at MTS schalmo@mtspartners.com.
*MTS IPO Database
The MTS bespoke IPO database includes the 785 US Biotech IPOs from the first 1979 US Biotech IPO with micro detailed analysis from 2012. Special thanks to Stelios “The Godfather” Papadopoulos for the historic data.